Everyone knows heat makes you slower. Almost nobody knows by how much. And when we set out to compute it properly for TrackLAB, we found that our biggest error was not the coefficient we were using — it was where we applied it. It is a mistake practically every temperature-adjusted pace calculator makes, and it takes two minutes to explain.
The question is badly framed
A forecast tells you «26 degrees». Nobody runs thinking in degrees. The real question is: how many minutes is that going to cost me?
Translating between the two needs three things: a curve relating temperature to performance loss, knowing the temperature you will actually face at each point of the course, and applying the curve in the right place. Let us take them in order.
What the data says
The largest study available is Helou et al. (2012): 1.7 million participants across six major marathons over a decade. The useful conclusions:
- The optimal temperature sits between 4 and 10 °C of air temperature for elite runners, and somewhat higher for everyone else.
- The relationship is not linear — it is quadratic. Near the optimum, one extra degree barely costs anything. The further you go, the more expensive each degree becomes.
- Heat and cold are not symmetric. Cold costs far less than the equivalent heat.
Later work by Mantzios (2022) across 1,258 elite races puts the optimum at 7.5–15 °C WBGT with a slope of 0.3–0.4 % per degree outside that range. At the Boston Marathon, looking at all finishers rather than just the front, the slope rises to about 0.75 % per degree.
Ultra is a different sport, and here the evidence runs out
This deserves to be said plainly: there is no ultra study comparable to those. Not for UTMB, not for Badwater, not for Comrades crossing finish times with temperature. The large Western States 2006-2023 analysis explicitly excluded weather because the organisers never recorded it.
The only quantitative thing that exists is a comparison between two editions of Western States: a hot one (7-38 °C) and a cool one (2-30 °C), with a performance difference of around 8 %. Two editions. Of one race. That is the entirety of the field evidence.
And there is a counterintuitive detail worth dwelling on: in that same work, the slowest runners were less affected than the fastest ones. That is the opposite of what happens in a marathon. The explanation makes sense: what heats the body is intensity, not duration. In a tropical marathon, 68 % of finishers exceed 40 °C core temperature. In ultras, measured peaks sit at 38.3-38.9 °C. Nobody reaches 40. You go slow, you walk the climbs, you stop at aid stations.
Dehydration, which you would expect to make things worse as it accumulates, does not show up either: in a 2025 field study of a 160 km ultra, average body mass loss was 4.8 % and it correlated with neither core temperature nor performance.
The curve we use
With that, the penalty TrackLAB applies over a 15 °C baseline is:
penalty (%) = 0.45 · ΔT + 0.015 · ΔT²| Temperature | Loss | Cost per degree |
|---|---|---|
| 20 °C | 2.6 % | 0.52 %/°C |
| 25 °C | 6.0 % | 0.60 %/°C |
| 30 °C | 10.1 % | 0.67 %/°C |
| 35 °C | 15.0 % | 0.75 %/°C |
At ΔT ≈ 12 °C — the gap between the two Western States editions — the curve gives 7.6 %. The observed figure was around 8 %. It fits, with all the humility that checking against a sample of two deserves.
And now, the error almost nobody sees
Here is the interesting part, and it is purely mathematical.
The natural thing to do is take the average forecast temperature for the race and apply the curve to it. It seems reasonable. It is wrong, and not by a little.
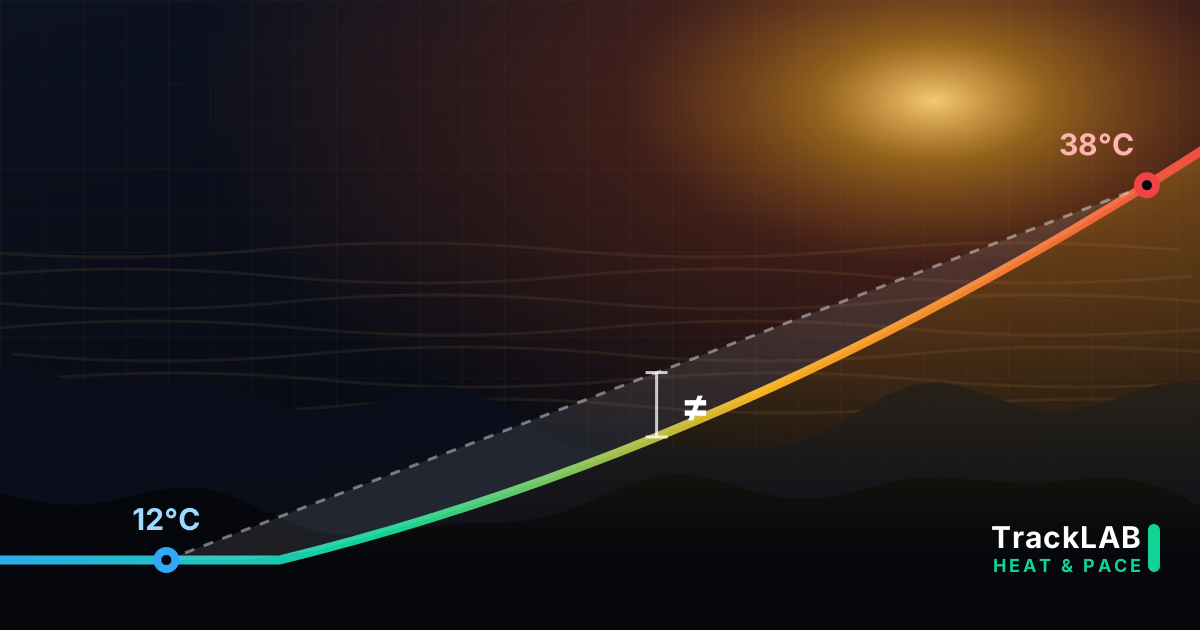
Take a real alpine ultra: you start in the afternoon at 31 °C, cross the night at 4 °C up high, the sun comes up and you finish at 30 °C again. The time-weighted average temperature of that race is 16 degrees. Practically the optimum.
Apply the curve to those 16 °C and you get a penalty of 0.5 %. In other words: the model tells you heat costs you six minutes in a race that starts and ends at thirty degrees.
If instead you compute the penalty at each point and then average, you get 3.3 %. Over a 21-hour race, the gap between those two figures is 36 minutes.
| Method | Penalty | Finish |
|---|---|---|
| Curve on the average temperature | 0.5 % | 21h06 |
| Integrated point by point | 3.3 % | 21h42 |
The reason has a name: Jensen's inequality. When a function is convex — and the heat penalty is, because it accelerates — the value of the function at the average is always lower than the average of the function's values. In plain terms: the cool night does not cancel out the heat of the day. The hours at 4 °C do not give back what the hours at 31 °C take away, because at 4 °C the penalty is zero and it cannot go below that.
Averaging first and penalising afterwards erases the heat. And the more variable the race — more elevation, more hours, more night — the bigger the error.
Body mass matters, but less than people say
You often read that a bigger runner suffers far more in the heat. It is true, and physics says by how much: the heat you produce scales with mass; the heat you shed scales with body surface, which goes as mass to the power two thirds. The ratio is the cube root of mass.
Between 56 and 80 kilos that is 13 % more thermal strain. Not double. At 30 °C, our model goes from 9.3 % for a 55 kg runner to 11.0 % for a 90 kg one.
One important detail: that correlation between mass and heat storage is strong at 35 °C, weaker at 25 °C and disappears entirely at 15 °C. The weight adjustment only makes sense when it is genuinely hot.
Humidity: the channel everyone forgets
The thermometer does not tell the whole story. What cools you is sweat evaporating, and in high humidity sweat does not evaporate: it soaks you and does not cool. In tropical marathon studies, 1.5 °C more wet-bulb temperature means over nine minutes on the finish time, at a similar dry temperature.
What is more, humidity's effect is just as large for fast runners as for slow ones, while dry temperature's effect does vary. That is why TrackLAB uses apparent temperature rather than the thermometer: it folds humidity in without asking the user for anything.
What we do not know
It would be easy to stop here and look clever. But a model whose weaknesses are never stated is a model you should not trust:
- The ultra coefficient rests on a comparison of two editions of one race. That is what exists.
- The fast/slow inversion is unreplicated. It is physiologically coherent, but it is a single finding. That is why TrackLAB does not scale the penalty by runner level: between two opposing and equally thin hypotheses, applying neither is the smallest error.
- Heat acclimation clearly reduces the penalty — on the order of 30-40 % after ten to fourteen days — but all the data comes from 30 to 90 minute tests. Extrapolating that to a twenty-hour race is exactly that: extrapolation.
- Wind and rain matter too, sometimes more than temperature. At Boston, a headwind cost more than the heat. A model that only penalises heat ends up blaming heat for things that are not its fault.
What to do with this
Three practical conclusions, whatever app you use:
- Be suspicious of any adjustment that uses a single temperature for the whole race. If your race has elevation or crosses the night, that number is lying to you, and always in the optimistic direction.
- Look at the temperature at the real altitude of the high points, not at the start village. The gap between what a weather model assumes and the real height of a col can be several degrees.
- Start time is the cheapest lever you have. In summer, starting three hours earlier can save you twenty minutes without a single extra day of training.
In TrackLAB all of this lives in Race Strategy: the temperature is computed at every summit, col and valley of the course — at its real altitude and at the time you will actually be there — and the penalty is integrated point by point. And we tell you the answer in minutes, which is the unit a race plan is read in.
Main sources: Helou et al., PLOS ONE (2012), impact of environmental parameters on marathon performance · Mantzios et al., MSSE (2022), analysis of 1,258 races · Parise & Hoffman (2011) on Western States · Marino et al., Pflügers Archiv (2000), body mass and heat storage · Nybo and Hue review in Frontiers in Sports and Active Living (2019).
This article describes an estimation model, not medical advice. Running in extreme heat carries real risks of heat stroke and hyponatraemia. If symptoms appear, stop.